After reading this article, you will be able to plan and implement experiments in marketing. This will enable you to contribute to the constant growth of your business. First, I’ll explain all the important concepts. Once we understand these, I will explain step by step how to conduct an experiment.
What are control groups?
If you want to prove a causal relationship between an experimental variable and an effect, you change this variable in a test group, but leave this variable unchanged in the so-called control group.
You could use an email with a header image in the test group and an email without a header image in the control group.
An adjustment is therefore made only in the test group or test groups and not in the control group. It is extremely important to change only one variable (e.g. the header image) in order to keep the test design and the necessary statistical analyses as simple as possible.
The results of the test groups and the control group are then analyzed for differences. Here it is important to examine the right KPIs for Growth Hacking. This could be, for example, the conversion rate of the emails.
Quantitative scientific research methods
Statistical calculations are used to investigate the probability that differences observed in an experiment are due to chance. If the probability, that these differences are due to chance, is very low, it is assumed that there is an effect.
In our example, we would ask ourselves: Is the conversion rate of the email with header image different from the conversion rate of the email without header image? And was this difference due to chance or not?
These are formulated as hypotheses. In general, the hypotheses to be formulated can be described as follows:
Null hypothesis: The two groups are the same
Alternative hypothesis: The two groups are different
Induction is a method of scientific research in which truths or findings about reality are inferred from an observation (an experiment). In our example, we want to find out whether the header image increases the conversion rate.
To do this, we formulate two specific hypotheses:
Null hypothesis: The conversion rates of the two groups are the same
Alternative hypothesis: The conversion rates of the two groups are different
To test the null hypothesis, we conduct an experiment. Based on the data collected in the experiment, we calculate the probability of the null hypothesis. If this probability is extremely low (e.g. less than 5%), we can reject the null hypothesis and conclude that the alternative hypothesis is true. In this case, we would have gained an insight into reality: The header image increases the conversion rate.
The threshold value, above which the null hypothesis is rejected in favor of the alternative hypothesis, is 95% confidence. This means that the probability that the null hypothesis is rejected, even though it would actually be true, must not exceed 5%.
This could also be formulated as follows: We can say with 95% certainty that the observation (e.g. “the header image increases the conversion rate”) is actually true.
If we have found a statistically significant effect, we can measure the uplift that this effect generates.
What does uplift mean?
If our test group and the control group have different values for the KPI under consideration and we can prove a statistically significant effect through our hypothesis test, it makes sense to compare the values of the KPIs.
To come back to our example: Let’s say the email with header image showed a conversion rate of 1.5% and the email without header image showed a conversion rate of 1.0%. This means that the email with the conversion rate caused an uplift of 50% in the conversion rate compared to the email without the header image.
Uplift is therefore about how much higher the performance of the test variant is compared to the control group.
Measuring Uplift
You can measure the uplift of a message A compared to a message B in order to optimize messages. You can calculate the uplift of a customer journey A compared to a customer journey B and use the findings to let the stronger customer journey continue. In performance marketing, you can also calculate the uplift of a campaign A compared to a performance marketing campaign B.
Using uplift as a criterion for the optimization of our marketing only makes sense, if we can say with sufficient certainty that the effect did not come about by chance. We ensure this by calculating statistical significance. We are guided by our data when optimizing.
Step by step instructions
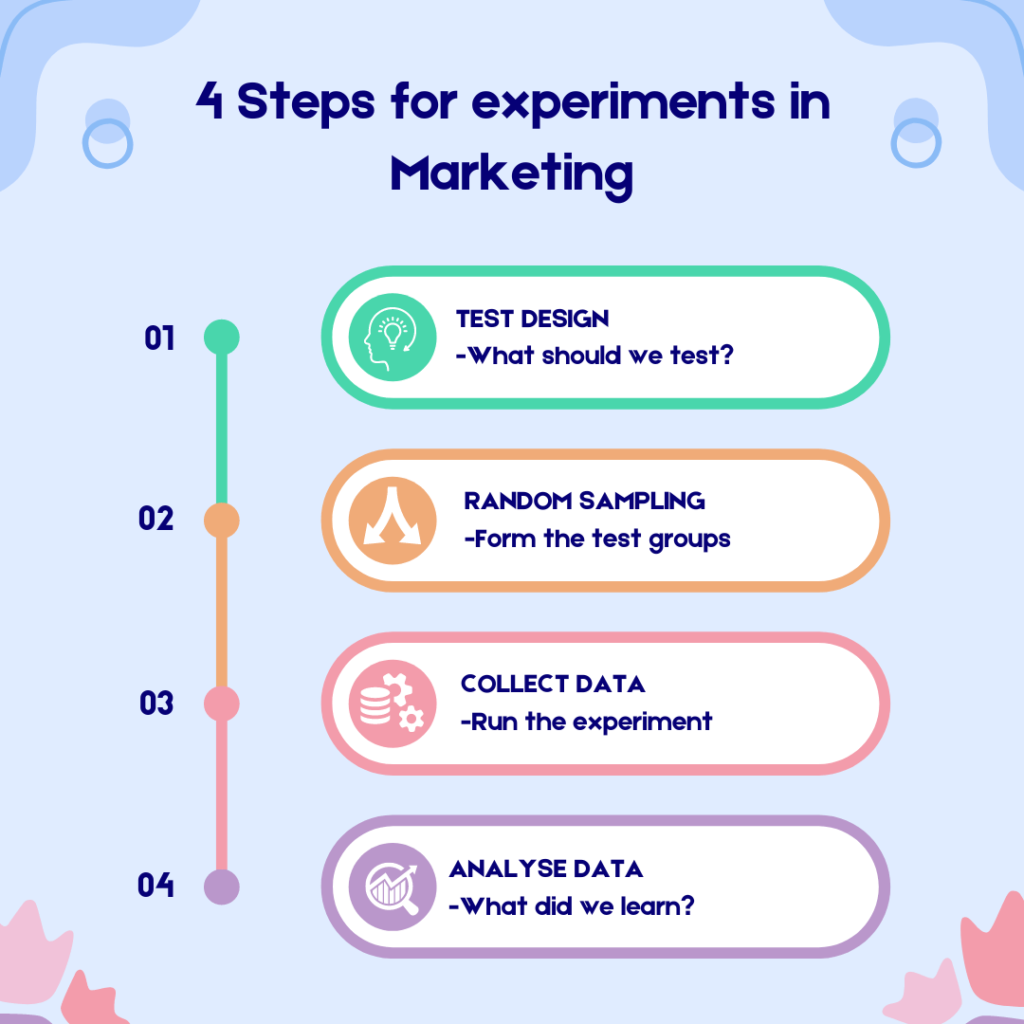
An experiment is carried out in four steps.
-
- Step: Test design
-
- Step: Form test groups by random sampling
-
- Step: Collect data
- Step: Analyze results
1. Test Design
First of all, we need to plan what we want to test and in which customer segment we want to carry out the test. There are many different test variables for Growth Hacking. Once we have decided on the variable to be tested, we now create the communication assets to be sent to our test groups.
As soon as the communication tools have been created, we can implement them into our marketing automation tool or our performance marketing tool.
2. Form test groups by random sampling
The test groups must be drawn at random. This means that we need a random generator to allocate our users to the test groups. It is a basic requirement for this type of experiment that we have a representative sample of the population of our users in each test group.
We must ensure that we do not distort the sample through the sampling method so that the findings are valid. A bias would occur, for example, if we selected all users over the age of 50 into our test group and the leftover users into our control group. We use a random draw to ensure that each test group contains the same number of users with the same characteristics.
3. Collect data
Next, we start our experiment. Now our users are assigned to the test groups and receive different communications. Be patient and don’t jump to conclusions. It is perfectly normal for the performance to fluctuate back and forth between the test groups until a sufficient amount of data has been collected.
The more data we collect, the closer we get to the true average performance of our test group.
4. Analyze results
It is difficult to calculate the necessary sample size in advance, that is when enough data has been collected to analyze the results. This is also dependent on the effect size to be demonstrated, which is not known before the experiment.
Statistical significance depends on two factors. The size of the effect, that is, the uplift compared to the control group, and the size of the sample. If we had a sample with millions of users, we would be able to detect even the smallest effects. Most of the time in marketing, we tend to work with thousands to hundreds of thousands of users.
To calculate the sample size, we can assume a minimum effect size. For example, for experiments that are intended to influence the conversion rate, we could assume that our experiment should lead to an uplift of at least 25% compared to the control group. After all, the experiment should find the strongest possible effects that optimize our marketing.
Once we have reached our desired data volume or the specified deadline, we read the data from our marketing automation tool or our database. We are only interested in the KPIs relevant to our experiment.
Now we have to select the correct method of analysis. If nominal data are available, the chi-square test is the correct method of analysis. If only two test groups (control group and test group A) were formed, the two-sample chi-square test is used to analyze the data. If more than two test groups were formed, the k-sample chi-square test has to be used. If there are more than two test groups, a post-hoc test with an adjustment (e.g. bonferroni correction) is also necessary to correct for errors due to the larger number of test groups.
If metric data is available, a two-sample t-test or z-test should be used for two test groups. If there are more than two test groups, the one-way ANOVA is the analysis method to be selected.
Above a certain sample size, it is no longer possible to carry out these calculations by hand, as this would take far too long. There are various tools with a graphical user interface to perform these calculations (such as SPSS).
From my own experience, I recommend learning the Python programming language and working with the code libraries available there (e.g. scipy). You first have to familiarize yourself with Python, but as soon as you learn how to use the language, you can analyse data much faster and more flexibly than with a graphical user interface.
Conclusion
Planning and conducting experiments is very simple. Only the statistical analysis of the results requires specialized knowledge. This can either be learned by yourself or provided by a data scientist.
To achieve results and drive continuous growth through experimentation, a structured approach is advisable. Growth Hacking is a methodology to continuously plan and conduct experiments. Customer experiences are complex communication constructs, especially as customers themselves and the world we live in are constantly changing. Companies that regularly work with experiments can react quickly to changing customer needs and benefit from change rather than fear it.